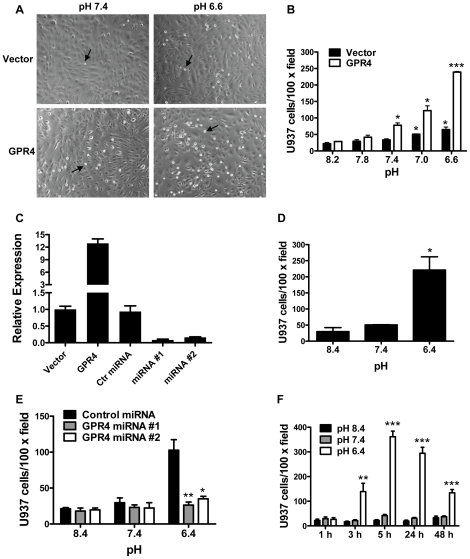
Figure 1. Acidosis/GPR4-induced adhesion of HUVEC cells.
(A) HUVECs stably expressing the MSCV-huGPR4-IRES-GFP construct (GPR4) or the MSCV-IRES-GFP control vector (Vector) were grown as a flat monolayer and treated with EGM-2/HEM media at varying pH for either 5 h or 15 h (overnight) which showed similar results. Then, 6×10⁴ cells/well of U937 monocytic cells were added to adhere with HUVECs for 1 h at pH 7.4, and the static cell adhesion assay was performed as described in the “Materials and Methods”. After the adhesion assay, the attached U937 cells were readily detected as small, round and reflectile cells under an inverted microscope with a 10× objective. Arrows indicate attached U937 cells. (B) HUVECs stably overexpressing GPR4 or the control vector were treated with different pHs as indicated. The cell adhesion assay was then performed. *, P<0.05; ***, P<0.001; compared with the pH 8.2 group. (C) HUVECs were transduced with various genetic constructs as indicated. Total RNA was isolated and mRNA levels of GPR4 were determined by real-time RT-PCR. Values were normalized to the housekeeping gene GAPDH. The expression level of GPR4 in HUVECs with the control vector was set as 1. (D) HUVECs stably overexpressing the mouse GPR4-GFP fusion gene were treated with different pHs as indicated, and then the cell adhesion assay was performed. Error bars are the mean ± SEM. *, P<0.05, compared with pH 8.4. (E) HUVECs were transduced with two GPR4 miRNAs or control miRNA, followed by pH treatment, and then the cell adhesion assay was performed. *, P<0.05; **, P<0.01; compared with the control miRNA group at pH 6.4. (F) HUVEC/GPR4 cells were treated with different pHs for various lengths of time as indicated, and then the cell adhesion assay was performed. **, P<0.01; ***, P<0.001; compared with the 1 h group at pH 6.4. The results are depicted as the mean ± SEM and representative of more than two independent experiments.

