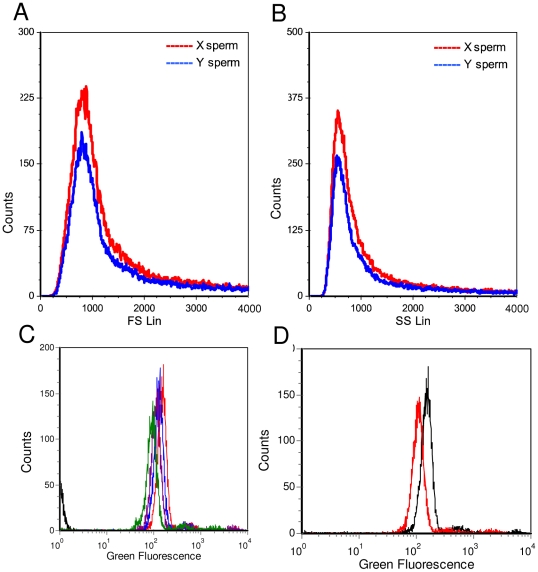
Figure 3. Uniform Venus fluorescence of X and Y chromosome bearing spermatozoa.
A), B) Venus fluorescence (forward and side signal) of oriented sperm from boar #503, after flow cytometric separation in X and Y chromosome bearing populations. C) Flow cytometric measurement of Venus-fluorescence in sperm of transposon transgenic boar #503 at four time points (0 min (red line, 30 min (blue line), 60 min (lilac line), 180 min (green line) of exposure to blue LED light, and a non-transgenic control boar sample (black line on the very left). Mean fluorescence intensities: Wt = 1. #503 (0 min = 153, 30 min = 130, 60 min = 113, 180 min = 93). D) Decrease of Venus fluorescence intensity in whole semen after long-term storage. Venus fluorescence was assessed directly after isolation (black line) and after storage at 4°C for four weeks (red line).

