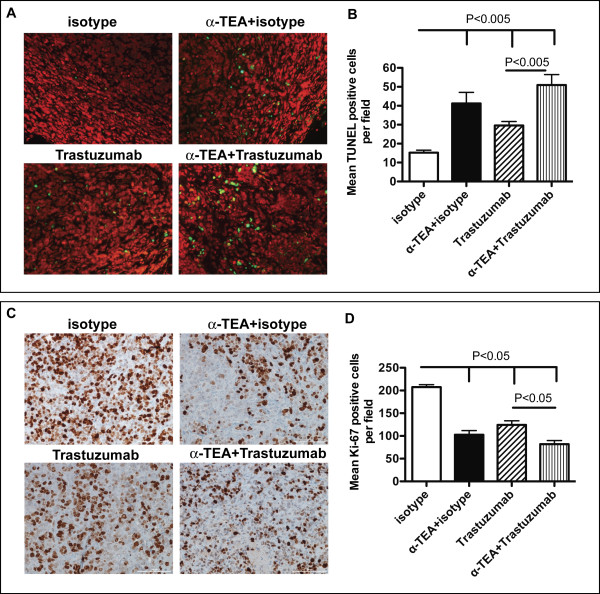
Figure 6.
Immunohistologic analysis of tumor tissue after α-TEA plus trastuzumab treatment. SCID mice with established MDA-MB-453 tumors (day 15 post-tumor injection), mice received α-TEA in the diet (~2 mg/day/mouse) or 40 μg trastuzumab by i.p. injection, every 2 to 3 days for a total of 7 injections. On day 30 post-tumor injection tumors were resected. (A) Tumors were examined for apoptosis by TUNEL assay. Representative images of tumor sections (20 × magnification) showing FITC-TUNEL-positive (green) and propipdium iodide counterstained (red) cells. (B) Mean number of positive stained cells per field (40 × magnification) in sections from 3 mice per group. (C) Tumors were examined for proliferation by Ki-67 immunostain. Representative images of tumor sections (20 × magnification) showing Ki-67-positive (brown) and hematoxylin counterstained (blue) cells. (D) Mean number of positive stained cells per field (40 × magnification) in sections from 3 mice per group.

