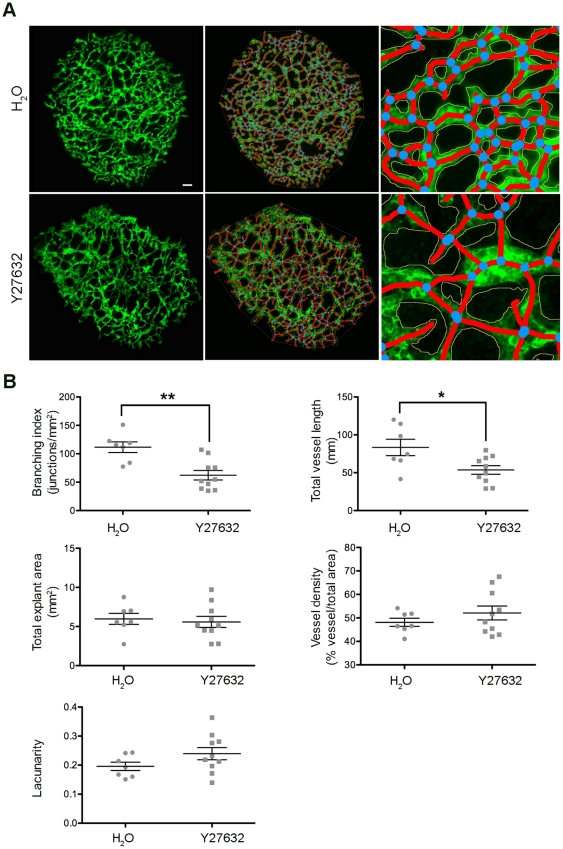
Figure 5. Analysis of angiogenesis in Y-27632 treated allantois explants.
Allantois explants were cultured in the presence of inhibitor or its vehicle, fixed, stained and microscopic photographs taken as described. (A) Representative images of a control (top) and a Y-27632 treated (bottom) allantois explant (left), their skeletonised images (middle panels) and a representative, enlarged part of the skeletonised images shown in the middle panels. The vessels outlines are represented in yellow, the skeleton in red and the branching points in blue. (B) Graphical representations of the analysis with AngioTool performed on seven control and ten Y-27632 treated explants. Statistical analysis was by T-test (Mann Whitney) *, p<0.05; **, p<0.01.

