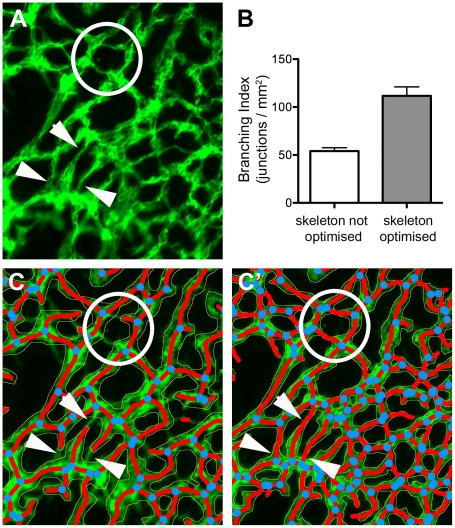
Figure 7. Optimising skeletons for a thorough analysis.
The control allantois explants for the experiment shown in Fig. 5 were overlaid according to the pre-set parameters (skeletons not optimised) or after careful optimisation. This lead to significantly different branching indices (B; p<0.001, Mann Whitney T-test). (A) shows an enlarged area of a stained explant; the same area is shown after skeletonisation using the pre-set parameters (C) or after optimisation (C'. A few examples of missed vessels and junctions in the non-optimised skeleton are highlighted by ringed areas and arrowheads.

