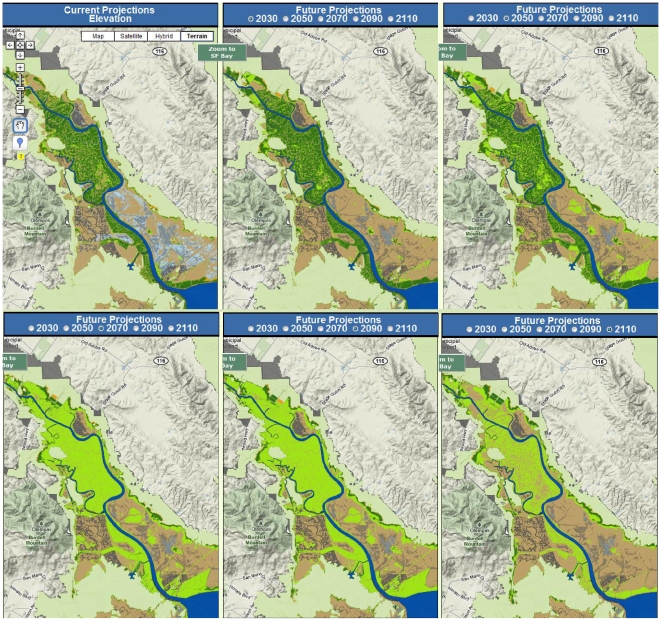
Figure 10. Projected elevation change for the most pessimistic scenario (low sediment, high SLR), using the on-line tool to zoom into the Petaluma River area.
Maps assume an absence of levees, roads, and other barriers to tidal inundation. Maps demonstrate the increase in low and mid marsh through mid-century, followed by a decline as SLR accelerates and outpaces accretion rates. Note the limited amount of landward marsh expansion (See Table S3 for area summaries).

