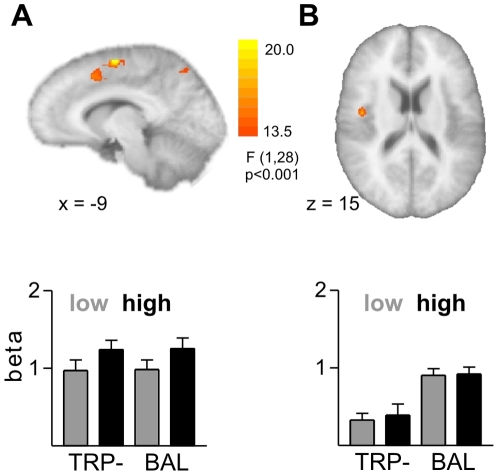
Figure 2. Imaging results for the decision phase.
A shows the main effect of provocation with an increased BOLD response in the dorsal ACC and below the corresponding beta values separately for the two groups (TRP- left and BAL right). In B depicted the main effect of the group factor with a higher BOLD response in the insula for the BAL group. Below the corresponding beta values separately for the two groups (TRP- left and BAL right).

