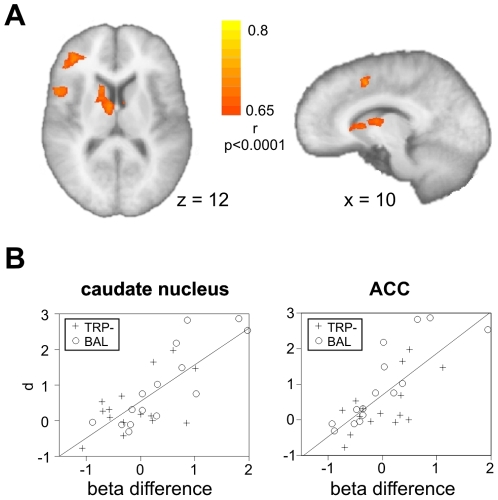
Figure 3. Imaging results for the outcome phase (first run).
A depicts the results of the correlational analysis for the outcome phase during the first run. Participants with a higher behavioral provocation effect showed an increased neural provocation effect in the caudate nucleus, dorsal ACC, insula and right inferior frontal gyrus. B For visualization purpose only, the correlation of the average difference in beta values in the caudate nucleus (left) and ACC (right) with the behavioral provocation effect (effect size d, selection high – low provocation, relative to the pooled standard deviance) is shown with the best linear fit. Participants of the TRP- group are indicated with a cross; BAL participants are shown with a circle.

