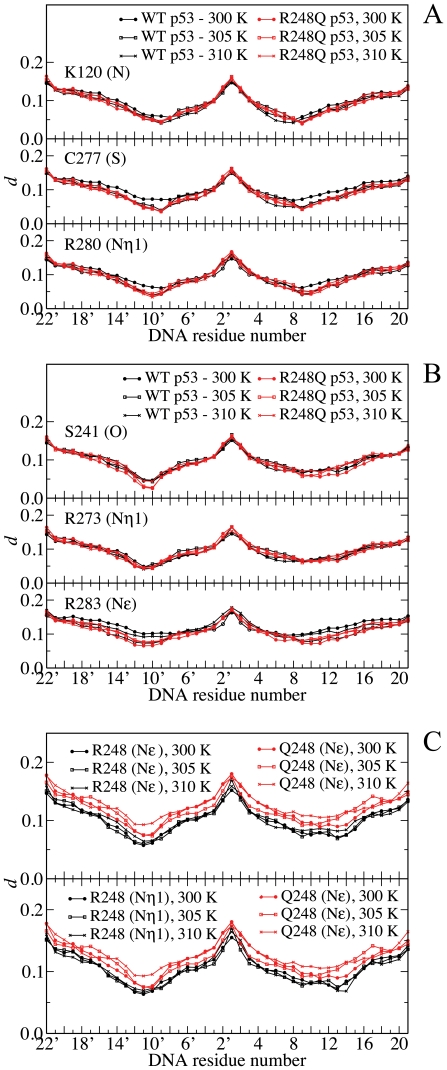
Figure 6. Plot of the dynamic correlation between DNA and contact sites.
Correlation between DNA and selected side-chain atoms of p53 involved in (A) major groove, (B) phosphate and (C) minor groove contacts for WT (black solid line) and R248Q p53 (red solid line). Small values of d represent a strong correlation between atoms, while large values indicate weak correlation. For arginine residues, Nη1, Nη2, and Nε atoms of the guanidinium group give rise to similar plots – a single atom is depicted for each residue, except for the minor groove contact. Each data point corresponds to an average over 5 equilibrated trajectory segments of 0.2 ns.

