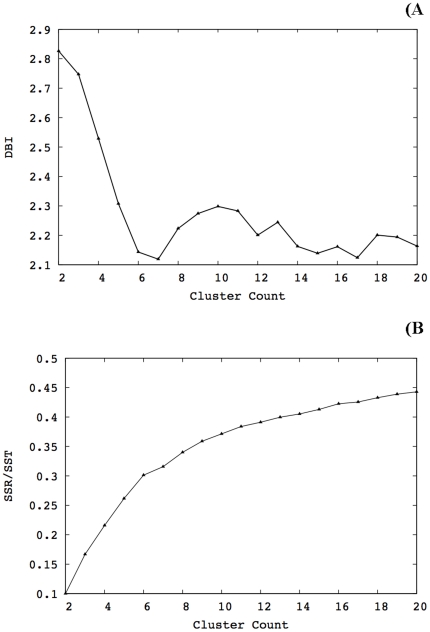
Figure 7. Clustering analysis for the wild type at 300 K.
DBI exhibited local minima at cluster counts of 7, 12, 15 and 17. The percentage of variance explained by the data (sum of squares regression/total sum of squares, i.e., SSR/SST) started to plateau after 14 clusters. Therefore, 17 clusters were extracted from the trajectory.

