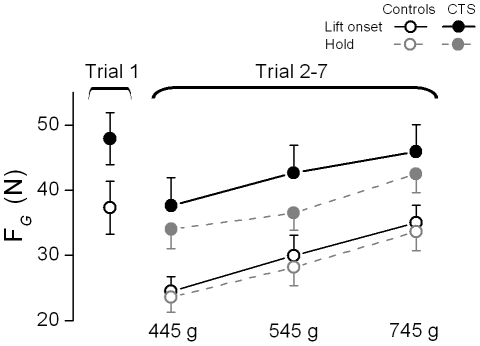
Figure 4. Grip force at object lift onset and object hold.
Grip force (FG) at object lift onset and during object hold on the 1st trial (averaged across all weights), and averaged across trials 2 through 7 are shown for the CTS and control groups (filled and open symbols, respectively) and each weight condition. Note that FG during object hold on the first trial is not plotted since FG did not change significantly across trials, i.e., FG during hold on the first trial = FG on trials 2-7. Vertical error bars denote standard errors.

