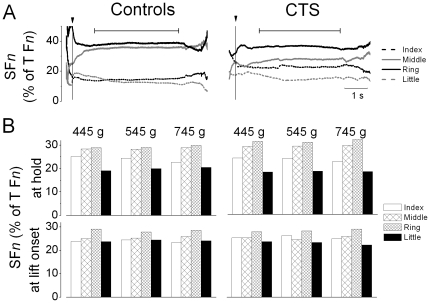
Figure 6. Digit force sharing patterns.
Panel A shows the time course of individual finger normal forces expressed as percentage of thumb (T) normal force from a representative CTS patient (S1) and her control (5th trial, 445 g condition). Data are aligned relative to object lift onset (vertical line). The horizontal bars denote object hold. Panel B shows force sharing patterns (SFn) averaged from trial 2 through 7 and all subjects for each weight condition measured at object lift onset and hold.

