
Figure 2.
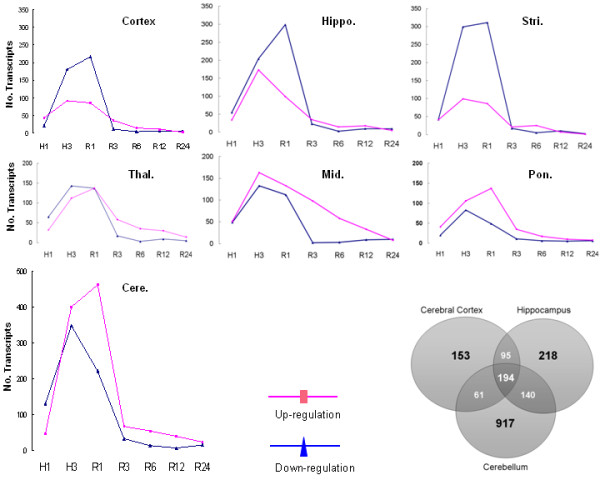
Regional differences in expression responses to hypoxia. Total number of up-regulated transcripts (red line, y-axis) was compared to the number of down-regulated transcripts (blue line, y-axis) in each brain region as a function of time (x-axis). Insert: Venn diagram of numbers of hypoxia-regulated transcripts in cerebral cortex (Cortex), hippocampus (Hippo.), and cerebellum during the whole time course investigated using a one way ANOVA, FDR < 0.05 and fold change > 1.5.