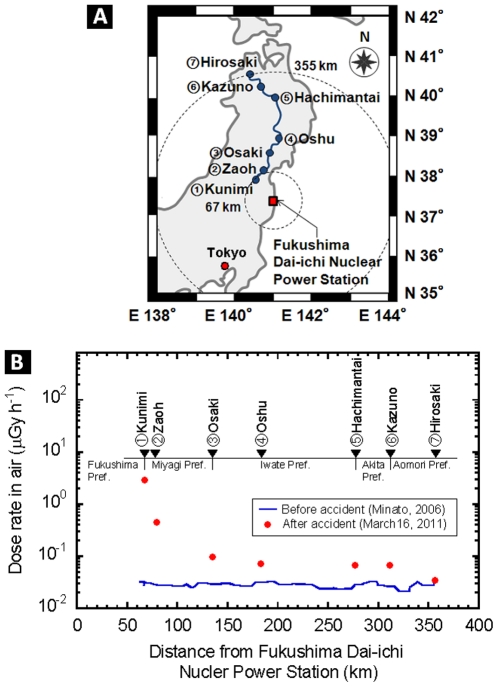
Figure 1. Location of Hirosaki City, Fukushima City and Fukushima Dai-ichi Nuclear Power Station on the map of eastern Japan (A).
The results of the absorbed dose rate in air at the seven parking area during the move from Hirosaki City to Fukushima City. The line shows the data measured at 2006 by Minato [8] (B).

