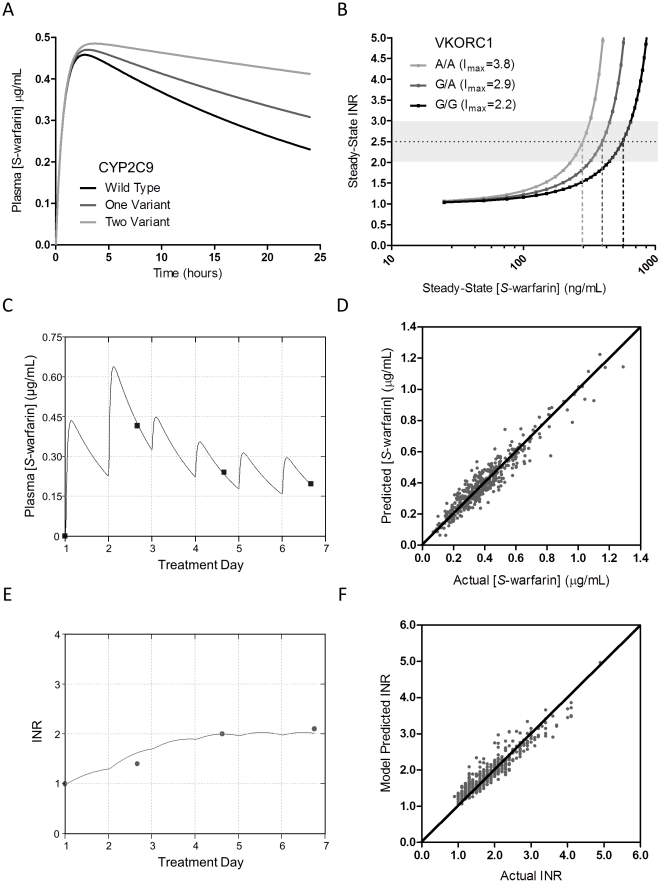
Figure 1. PK-PD model performance.
(A) Model simulated S-warfarin plasma concentration-time profiles after single dose with CYP2C9 variant alleles. (B) Model simulated steady-state therapeutic INR (2.5) vs. S-warfarin plasma concentration with varying Imax corresponding to VKORC1 -1639G>A genotype. (C) Model fit of measured S-warfarin concentrations in a single patient. (D) Scatter plot of actual vs. predicted S-warfarin plasma concentration throughout the initiation phase (coefficient of determination, r2 = 0.91, n = 459). The diagonal line represents the unity line. (E) Model fit of measured anticoagulation INR response values in the same patient as in (C). (F) Scatter plot of actual vs. predicted INR during the initiation phase (r2 = 0.89, n = 459). The diagonal line represents the unity line. Imax, maximal inhibitory factor; INR, international normalized ratio.

