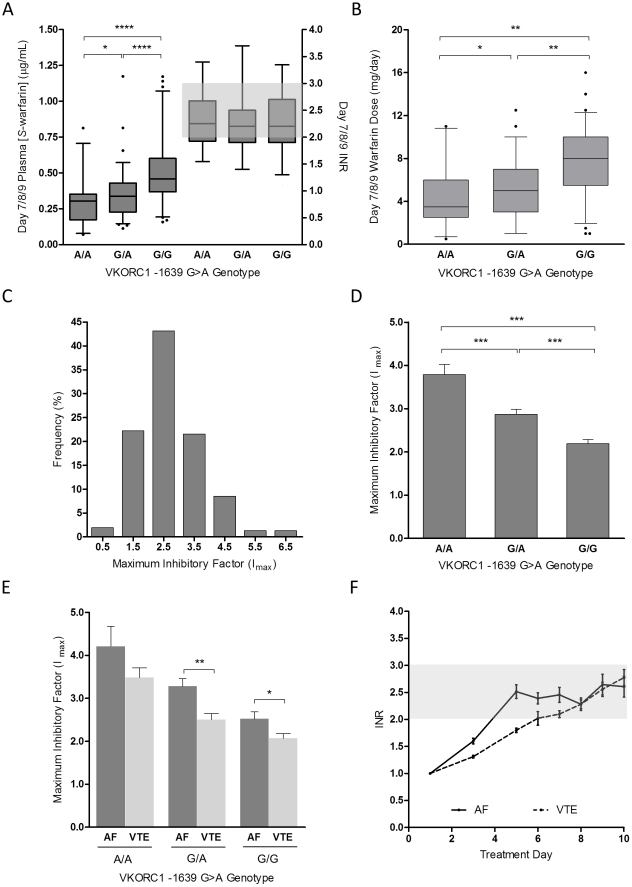
Figure 3. Determinants of maximal inhibitory factor, Imax.
(A) Box-and-whisker plots of S-warfarin plasma concentration and INR on days 7/8/9 segregated by VKORC1 -1639G>A genotype. Box-and-whisker plots representing VKORC1 gene-dose effect during initiation. The top and bottom of the boxes represents 25th and 75th percentile, respectively; median is represented by the middle line, whiskers are the 95% CI, and outliers are identified as closed circles. (B) Warfarin daily dose on days 7/8/9 with respect to VKORC1 genotype. (C) Frequency distribution of estimated Imax, shown as percent of total patients for each bin. (D) Association between VKORC1 genotype and Imax. Results are represented as mean with standard deviation. (E) Additive effect of indication for warfarin therapy and VKORC1 genotype on Imax. (F) INR time course for patients with AF and VTE over the initial 10 days of therapy with common genetics-guided dosing protocol. Results are represented as mean with 95% CI of the standard error. AF, atrial fibrillation; INR, international normalized ratio; VTE, venous thromboembolism. * P<0.05, ** P<0.01, *** P<0.001, **** P<0.0001.

