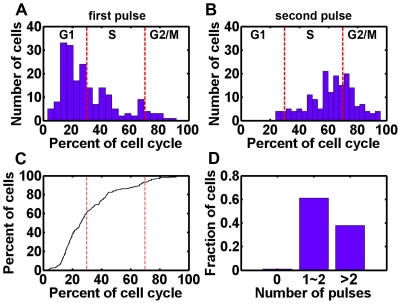
Figure 6. Pulse correlation with cell cycle.
(A and B) Distribution of first (A) and second peaking times. Dashed lines are guide lines for different cell cycle phase. (C) Cumulative distribution of first peaking times. Dashed lines are guide lines for cell cycle phase. (D) Number of pulses in one cell cycle.

