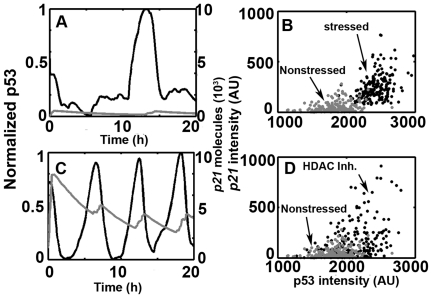
Figure 8. P53 and p21 dynamics under stressed and nonstressed conditions.
(A and C) p21 (grey) and normalized p53 pulses (black). (B and D) Scatter plots of p53 and p21 integrated responses. (B) Stressed (black) versus nonstressed (grey) conditions. (D) HDAC (black) versus nonstressed (grey) conditions, HDAC: histone deacetylase.

