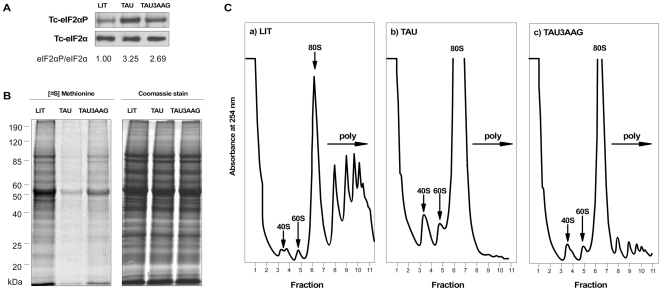
Figure 3. Nutritional stress leads to increased phosphorylation of eIF2α and to inhibition of translation.
(A) Immunoblots of equivalent amounts of epimastigotes incubated in rich medium (LIT), or incubated for 2 h in TAU (TAU), or incubated for 2 h in TAU followed by incubation for 2 h in TAU3AAG (TAU3AAG), using antibodies that specifically recognize phosphorylated eIF2α (Tc-eIF2αP) and total Tc-eIF2α. The numbers below each lane show the relative rate of phosphorylated eIF2α and total eIF2α. (B) Incorporation of [35S]-methionine by epimastigotes subjected to identical growth conditions as in (A). Samples were resolved on SDS-PAGE for autoradiography (left panel). The Coomassie Blue stained gel is shown on the right panel. (C) Polysome profiles of cell extracts prepared from epimastigotes subjected to identical growth conditions as in (A). A total of 10 A260nm units were fractionated through a 7–47% linear sucrose gradient. The arrows indicate the peaks for the 40S and 60S ribosomal subunits, the 80S monosome peak; the polysomes are indicated with a bracket (poly). This result is an example of similar results obtained in three independent experiments.

