
Figure 2.
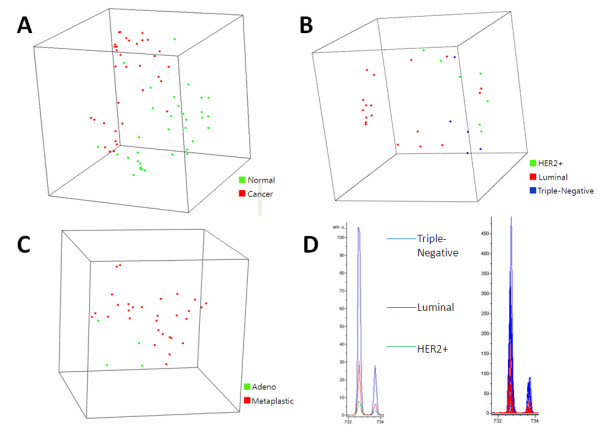
Principal component analysis and Intensity Profile. (A) A principal component analysis plot for 34 pairs of breast cancer (shown in red) and adjacent normal (shown in green) tissue samples, which graphically represents 1-correlation distances among samples. Each sphere represents a single sample, and samples whose protein expression profiles are very similar are shown close together. (B) A principal component analysis plot for luminal (shown in red), HER2+ (shown in green), and triple-negative breast adenocarcinoma samples (shown in blue) (C) A principal component analysis plot for metaplastic carcinomas (shown in green) and adenocarcinomas (shown in red). (D) Intensity profile for a representative lipid (m/z = 732.58 in the positive ion mode) differentially expressed among intrinsic subtypes. The average peak of the intrinsic subtype (left) and all single peaks (right) are shown.