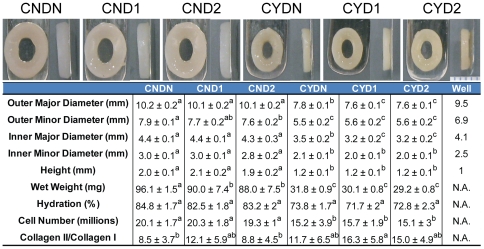
Figure 3. Construct gross morphological images and properties.
White scale bar in lower right corner of gross morphology images is equal to 5 mm. Geometric properties, construct wet weight, hydration, cell number, and Collagen II/Collagen I ratio are shown in tablature form and illustrate the large effect on these properties by chemical stimulation. For group labeling, the letter following the C denotes if chemical stimulation was applied (N = no, Y = yes) and the character following the D denotes the time window of mechanical stimulation application (N = none, 1 = days 10–14, 2 = days 17–21). All data are presented as mean ± s.d. Statistically significant differences are present between values that do not share a common letter for a particular metric.

