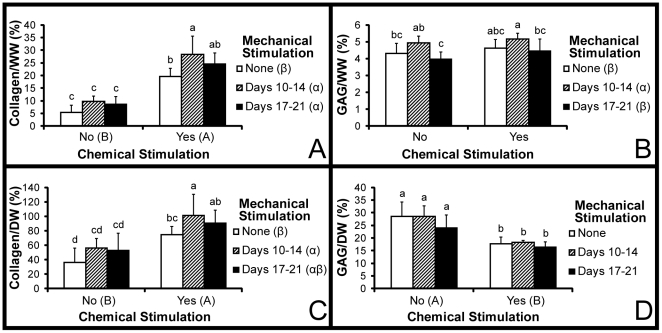
Figure 5. Biochemical properties.
Both collagen per wet weight (A) and collagen per dry weight (C) were significantly increased by chemical and mechanical stimulation. GAG per wet weight (B) was significantly increased by D1 treatment only while GAG per dry weight (D) was decreased by chemical stimulation. All data are presented as mean ± s.d. Statistically significant differences are present when a common letter is not shared between levels of a factor or by individual groups. For mechanical stimulation, the characters α, β, and γ are used. For chemical stimulation, letters A and B are used. For comparisons among the 6 treatment groups, the letters a, b, c, d, and e are used.

