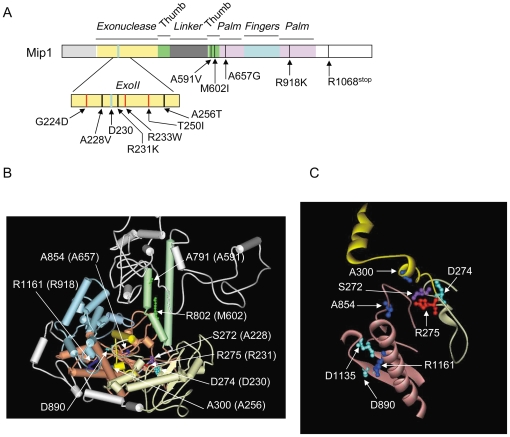
Figure 2. Localisation of antimutator and hypermutator mip1 mutations.
(A) Linear representation of the Mip1 amino acid sequence. The black and red bars represent the antimutator and hypermutator amino acid substitutions, respectively. The thick blue bar represents the catalytic Asp230 residue in the 3′-5′ exonuclease domain. (B) Three dimensional structure of human pol γ (pdb ID: 3IKM) showing the human residues that are equivalent to Mip1 antimutators. Residue numbering is that of human pol γ. The equivalent Mip1 residues are given in the brackets. The 3′-5′ exonuclease domain is in yellow; the thumb, fingers and palm subdomains are in green, blue and pink, respectively. The N-terminal and linker regions are in grey. The helix-coil-helix module (residues 295–312) in the 3′-5′ exonuclease domain [27] is in intense yellow. Catalytic residues of the 3′-5′ exonuclease (D274) and polymerase (D890) domains are in cyan blue. (C) Zoom on the 3′-5′ exonuclease and palm elements of human pol γ that host Mip1 antimutators. Catalytic residues in the 3′-5′ exonuclease (D274) and polymerase (D890 and D1135) domains are in cyan blue. Figures B and C were prepared using Accelrys DS Visualizer 1.7 software.

