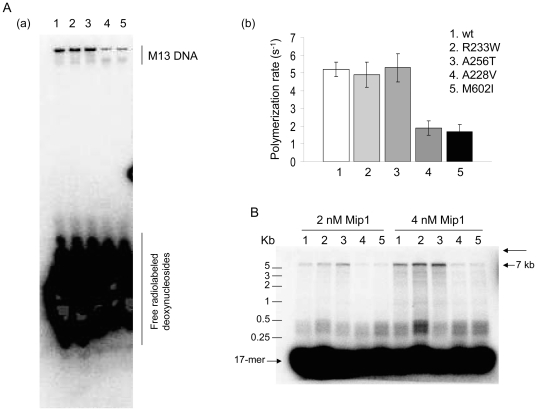
Figure 4. DNA polymerase activity.
(A) Total DNA synthesis. The assays carried out in the presence of [α-32P]-dCTP, 0.3 nM Mip1 and 19 nM primed M13 ssDNA and the short electrophoresis in a 13% polyacrylamide/urea gel were performed as reported in Materials and methods. A single band corresponding to radiolabeled M13 DNA was observed (a) and its intensity was quantified (b) after phosphor exposure of the dried gel. Specific activities (s-1) are the average of 3 independent experiments. (B) Processivity. The formation of a complex between Mip1 (2–4 nM) and primed M13 ssDNA (60 nM) followed by the DNA synthesis assay in the presence of the A1/B1 trap (500 nM) was performed as reported in Materials and methods. The long thin arrow indicates the position of the wells. The DNA products were visualized and quantified after alkaline agarose gel electrophoresis and Phosphor screen exposure of the dried gel as reported in Materials and methods. Based on 3 independent experiments, the size of the DNA products were 1700 nts for wild-type Mip1, 1600 nts for Mip1-R233W, 1700 nts for Mip1-A256T, 540 nts for Mip1-A228V and 430 nt for Mip1-M602I. The estimated size of the DNA molecules was similar for the two Mip1 concentrations.

