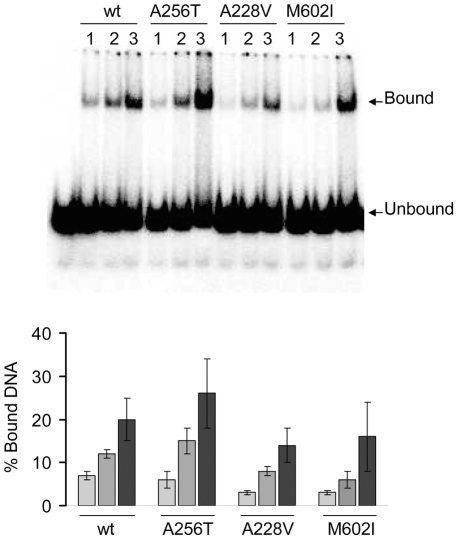
Figure 7. DNA binding activity of wild-type and mutant Mip1.
The formation of a Mip1-DNA complex was determined by an electrophoretic mobility shift assay (EMSA), using the [32P]-labeled A1/B1 primer-template substrate (0.7 nM) and increasing Mip1 concentrations (1, 2, 4 nM) as reported in Materials and methods. A. Illustration of the signals obtained after electrophoresis in a native 6% acrylamide gel and Phosphor screen exposure of the dried gel. B. Quantification of the data. The values are the average of 3 independent experiments and bound DNA is calculated as reported in Materials and methods.

