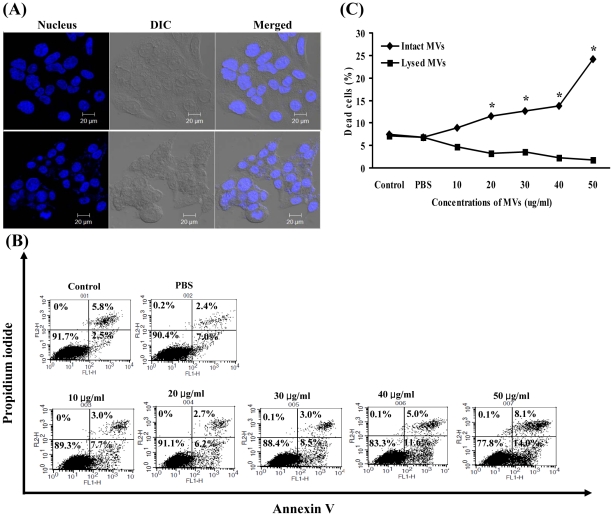
Figure 4. Host cell death induced by the S. aureus MVs.
(A) HEp-2 cells were treated with 50 µg/ml of MVs for 24 h and stained with DAPI. Upper and lower panels are untreated control cells and S. aureus MV-treated cells, respectively. S. aureus MVs induced host cell pathology, such as condensation of nuclei, nuclear fragmentation and cellular shrinkage. DIC, differential interference contrast microscopy. (B) Flow cytometric analysis of cell death induced by the S. aureus MVs. Upper panel, control cells without MVs and with PBS for 24 h. Lower panel, HEp-2 cells were treated with various concentrations of S. aureus MVs for 24 h. Representative data from three independent experiments are shown. In the graph, cells in right upper and lower parts represent apoptotic cells, and cells in left upper part represent necrotic cells. (C) HEp-2 cells were treated with various concentrations of intact MVs or MVs lysed with EDTA for 24 h. Cells were stained with Annexin V and PI, and then 104 cells were analyzed by flow cytometry. All dead cell population, including Annexin V+/PI+, Annexin V+/PI− and Annexin V−/PI+ fractions, were calculated. Data are presented as mean ± standard error in three independent experiments. *Statistically significant at p<0.05 using a Student's t-test.

