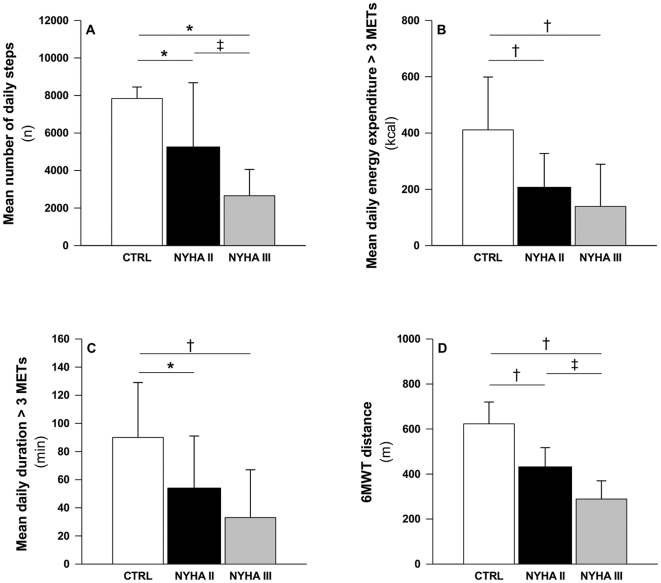
Figure 3. Relation between daily life physical activities and exercise capacity with the New York Heart Association functional class.
Mean number of daily steps (panel A), mean daily energy expended during physical activities inducing a metabolic demand >3 METs (panel B), mean daily duration of physical activities inducing a metabolic demand >3 METs (panel C), and six-minute walk test (6MWT) distance (panel D) in healthy control subjects (CTRL; open bars) and in patients with pulmonary arterial hypertension in New York Heart Association (NYHA) functional class II (dark bars) and III (grey bars). Values are mean (SD). * p<0.05 and † p<.001 vs. CTRL; ‡ p<0.001 vs NYHA II. Figure legend: n, number; kcal, kilocalories; min, minute; m; meter.

