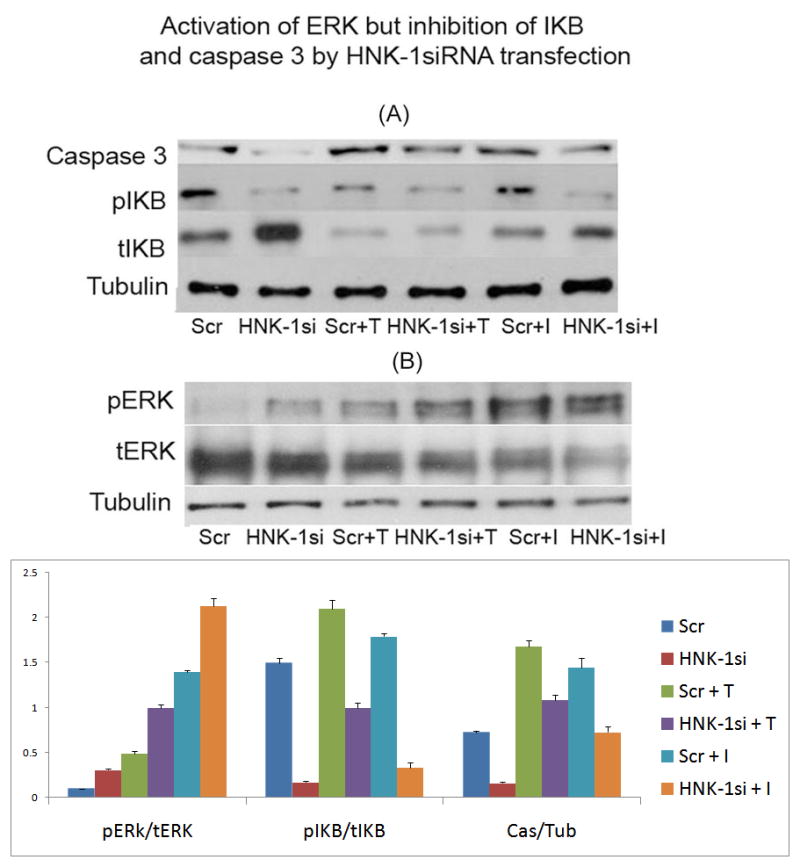
Figure 1. Activation of ERK and inhibition of IKB and caspase 3 by HNK-1 siRNA transfection.

(A) Inhibition of caspase 3 and IKB, (B) Activation of ERK. Cells were exposed to cytokines overnight (between 18–24 h) and protein was dissolved using Lemmelli buffer. The protein bands were separated and identified using specified antibody.
Scr, Scrambled siRNA transfection; HNK-1si, HNK-1ST siRNA transfection; Scr + T, Scrambled siRNA + TNFα; HNK-1 si + T, HNK-1ST siRNA + TNFα; Scr + I, Scrambled siRNA + IL-1β; HNK-1 si + I, HNK-1ST siRNA + IL-1β.
Lower figure: Each band (area) was scanned and quantified using the ImageJ program. The ratio of two band area such as pERk/tERK, pIKB/tIKB, and caspase 3/tubulin was determined and plotted. Bar represents SD from at least 3 independent experiments, Comparison was made by T-test analysis between each set, Scr vs. HNK-1si, p < 0.005; Scr + T vs. HNK-1si + T, p < 0.0005; Scr + I vs. HNK-1si + I, p < 0.0005. Comparison between groups using two-way ANOVA indicates the significance with a p value of 1.59×10⁻¹⁰.
