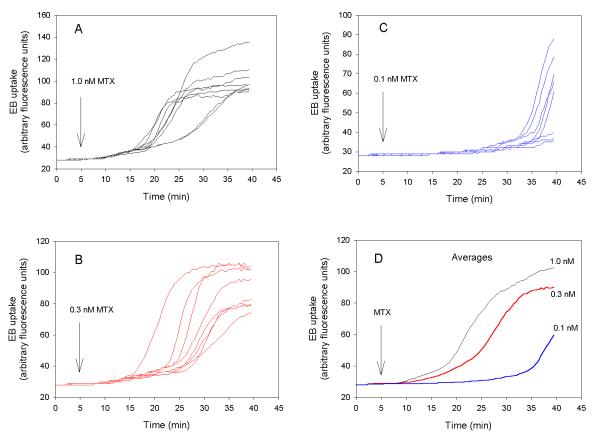
Figure 4.
Effect of MTX on EB uptake in BAECs at the single cell level.Panels A, B, and C. BAECs on glass cover-slips were perfused with HBS containing EB at 37°C and fluorescence was measured in individual cells as described in Material and Methods. At the time indicated by the arrow, the bath solution was exchanged for one containing 1 (black), 0.3 (red) or 0.1 (blue) nM MTX. Fluorescence recordings from 8 individual cells are shown in each panel. Panel D. The average single cell EB uptake as a function of time was determined from the data shown in panels A, B, and C. The concentration of MTX is indicated to the right of each trace. Results shown are representative of 3 individual experiments.

