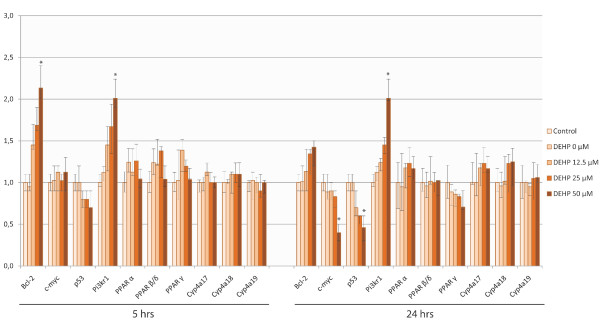
Figure 4.
Expression level of bcl-2, c-myc, p53, pi3kr1, PPARs and CYP4 family gene mRNA after treatment of SHE cells with DEHP, using qPCR. These histograms show the ΔΔCt score normalized by the gapdh mRNA level. Error bars represent the standard deviation of the ΔΔCt score. Only mRNA levels showing a two-fold increase or decrease at least, were considered indicative (*) of a change in the gene expression. We observed a significant increase in the bcl-2 mRNA level after 5 hrs of exposure and a significant decrease in c-myc and p53 mRNA levels after 24 hrs of DEHP exposition. Pi3kr1 was found to be over-expressed for both lengths of exposure. None of PPARs or CYP4 genes was significantly over- or under-expressed after treatment.

