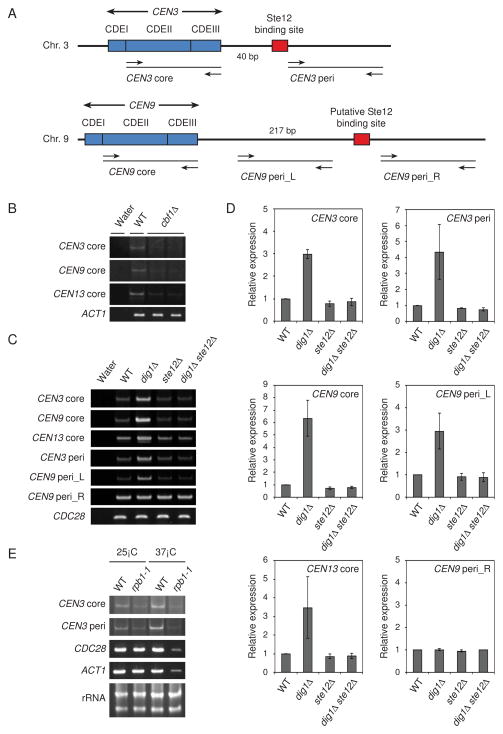
Figure 3. Centromeric transcripts in Saccharomyces cerevisiae.
(A) Schematic representations of the CEN3 and CEN9 regions. Arrows mark the location of primers. The Ste12 binding site of CEN3 (TGAAACG) is located 41–47 bp from CDEIII. The putative Ste12 binding site of CEN9 (TGTAACA) is located 218–224 bp from CDEIII. (B) Transcription derived from CEN3, CEN9, and CEN13 was detected in the wild-type but not in the cbf1Δ mutants. RT-PCR analyses were performed from log phase total RNA in wild-type (YPH499) and cbf1Δ mutants (Y1987 and Y1988). ACT1 was used as a loading control. (C) Accumulation of transcripts derived from the core or pericentromeric regions in the dig1Δ mutant was determined with RT-PCR. CDC28 was used as a loading control. The yeast strains used were as follows: wild-type (YPH499), dig1Δ (Y1979), ste12Δ (Y1985), and dig1Δ ste12Δ (Y2056). (D) Quantification of transcripts in (C). Relative expression levels were calculated by dividing CDC28 expression level. (E) RNA polymerase II is required for the CEN3 transcripts. RT-PCR analyses were performed from log phase total RNA in wild-type (YF7) and the largest subunit mutant of RNA polymerase II (rpb1-1) (YF38). CDC28 and ACT1 were used as positive controls. Ribosomal RNA was used as a loading control.

