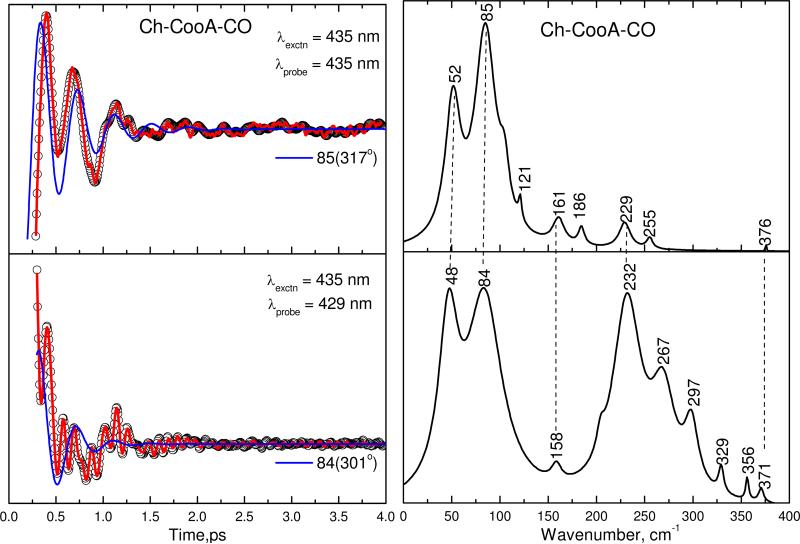
Figure 6.
The open-band and detuned coherence spectra of the CO bound form of Ch-CooA at pH 8. The pump and probe wavelengths are given in the inset. The left panel shows the oscillatory components (circles) and the LPSVD fits (solid red lines). The LPSVD components corresponding to the dominant mode are also shown (blue solid lines), along with the extracted phases. The right panels show the corresponding power spectrum amplitudes. The correlated modes are shown by dotted lines.

