
Figure 3.
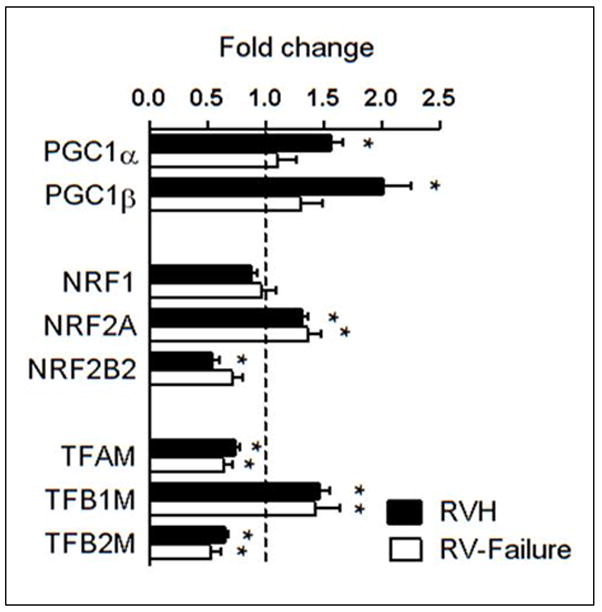
mRNA levels of the PGC-1 pathway in overloaded RV. Mean of the fold changes ± SEM in gene expressions for the PGC-1 pathway in the RVH (n=25) and RV-failure (n=6) relative to Non-Failing controls (indicated by the dashed line; n=5; * p≤0.05 vs. Non-Failing).