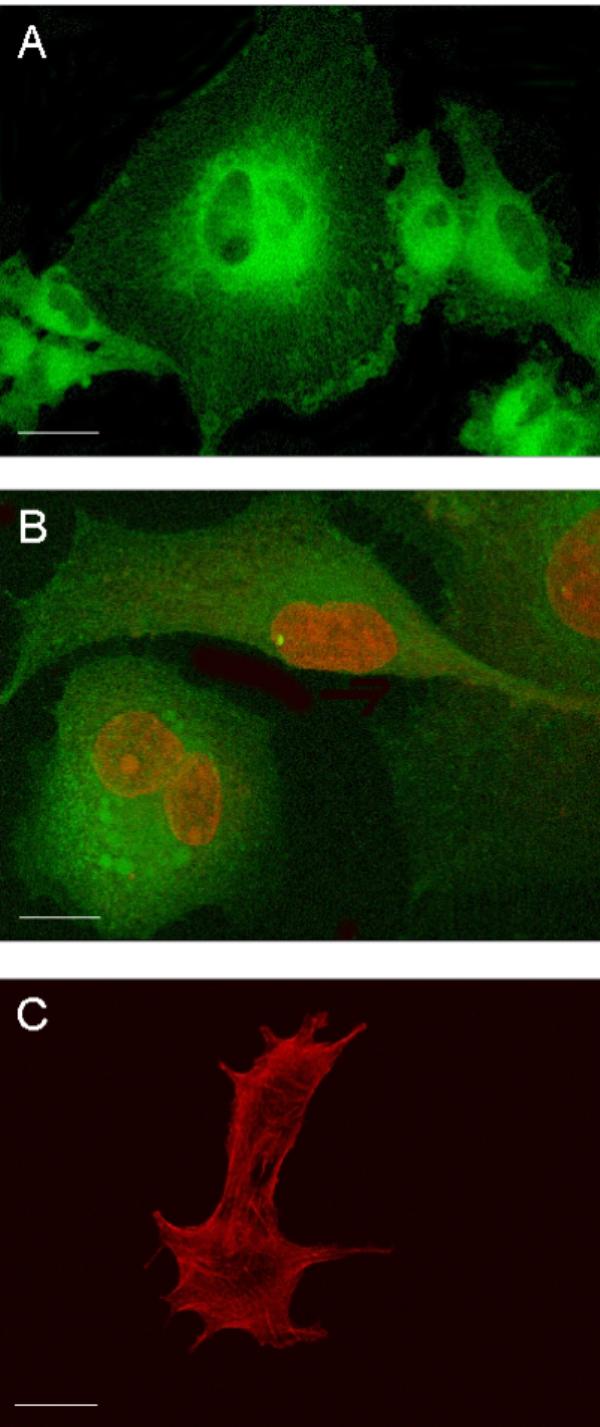
Figure 1.

Confocal images of different GL15 cell typology. Panel A: an overlay of single-section images of cells, stained with Paclitaxel-Bodipy (green fluorescence), shows tubulin organization in the cytoskeleton; panel B: an overlay of single-section images of cells, double-stained with Mitotracker-Green488 and Propidium Iodide, highlights mitochondrial network (green fluorescence) and lobate nuclei (red fluorescence); panel C: single median-section image of two cells, stained with Phalloidin-Alexa594 (red fluorescence), shows actin organization in the cytoskeleton. Bar = 25 μm.
