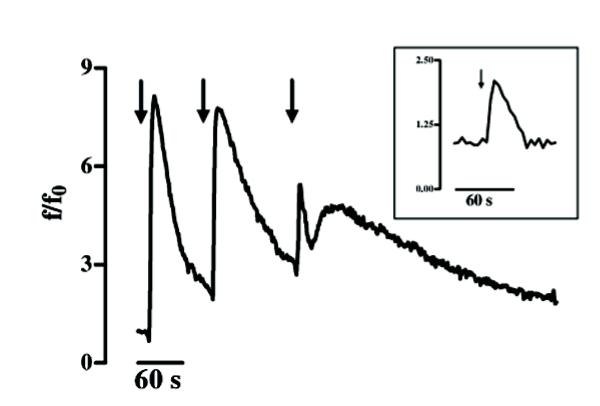
Figure 3.
KCl-evoked Ca2+ spikes in GL15 cells. The graph shows the trace of intracellular Ca2+ variations in a single cell responding to extracellular 50 mM KCl pulses (arrows). The solid trace represents the [Ca2+]i variations found in 100% (n = 60) of the differentiated tested cells. The trace in the box represents the [Ca2+]i variations found in 70% (n = 47) of the undifferentiated cells. Time (s=seconds) is indicated on the abscissa; the ordinate gives the normalized fluorescence value (f/f0).

