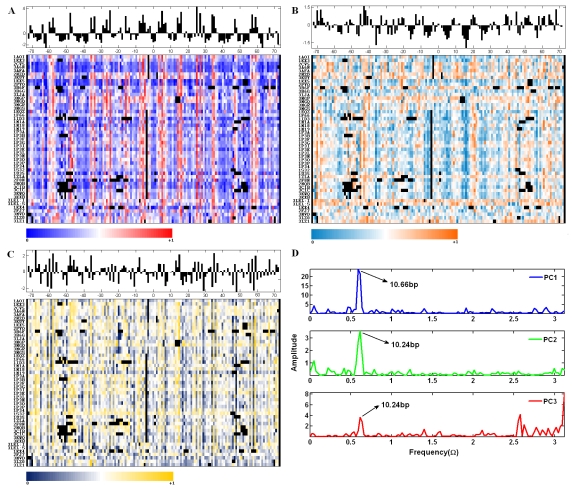
Figure 1.
The profiles of structural variations described by the values under principal dimensionalities and periodicities hidden in the variations. (a), (b) and (c): the spectrums of sequential structural variations in terms of scaled PC1, PC2 and PC3 scores respectively for the 49 nucleosome paths. Original scores of PC1, PC2 and PC3 are converted to a color-coded value range of 0˜1. The inserted blanks for an optimal alignment and the base pairs deleted by 3DNA are represented by black squares in spectrums and are excluded from the statistics. The histograms above the spectrums stand for the averaged value of position-specific original scores over all the nucleosomes. (d) The frequency spectrums based on the Fourier Transform on the averaged PC scores varying with positions.

