
Figure 4.
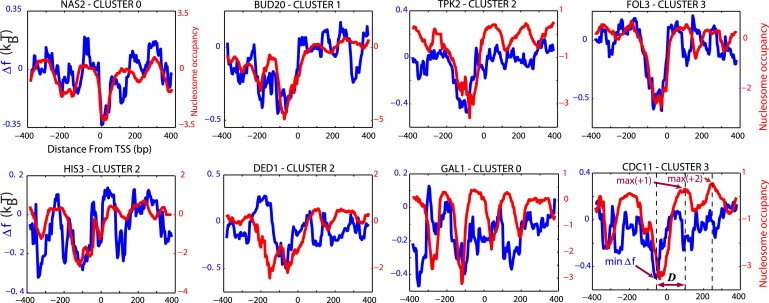
Single-gene examples. The nonspecific TF-DNA binding free energy (normalized per bp) profiles, (blue), computed for eight individual genes. The corresponding nucleosome occupancy profiles are shown for comparison (red). The last example (CDC11) shows the position of the minimum of , and the maxima of the nucleosome occupancy of +1 and +2 nucleosomes, respectively.