
Figure 5.
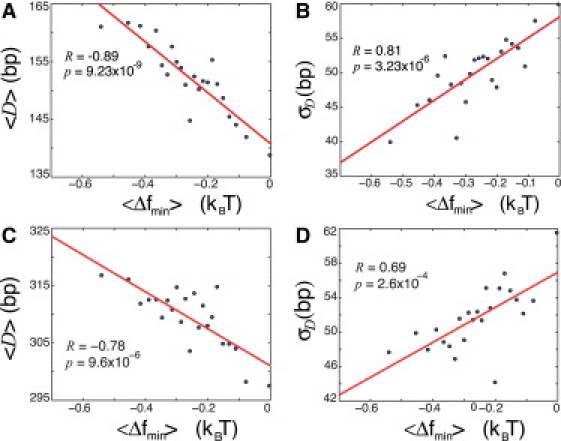
(A) Correlation plot of the average distance, , between the minimum, , of in the range (−150,0) and the maximum of the nucleosome occupancy in the range (0,150) for +1 nucleosome (see CDC11 gene example in (Fig. 4)). All 5014 genes from all clusters are grouped into 23 bins (218 genes in each bin). D and is computed for each individual gene in each bin, and the averages, and , are then computed in each bin. (B) The standard deviation, , of D for individual genes is computed in each bin as a function of . (C) The average distance, , between the minimum, , of in the range (−150,0) and the maximum of the nucleosome occupancy in the range (150,300), corresponding to the +2 nucleosome. (D) The standard deviation, , of D for individual genes for the +2 nucleosome is computed in each bin as a function of . All free energies are normalized per bp, as above.