
Figure 10.
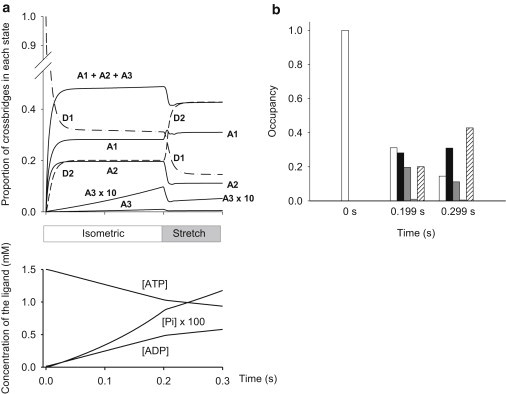
Occupancy of the states during a simulated contraction with stretch. (a) Results of the simulation of the contraction: isometric from 0 to 0.2 s, then stretch until 0.3 s. (Upper graph) Time course of the occupancy of each state as a proportion of the total cross-bridge population. (Lower graph) Corresponding concentrations of ligands, ATP, ADP, and Pi. Note that these are free concentrations and that the values for Pi have been multiplied by 100 for visibility. (b) The figure picks three time-points in panel a, namely before contraction (t = 0 s), at the end of the isometric period (t = 0.199 s), and during stretch (t = 0.299 s) to show how state occupancy differs. Open bars: D1; black bars: A1; dark gray bars: A2; light gray bars: A3; hatched bars: D2.