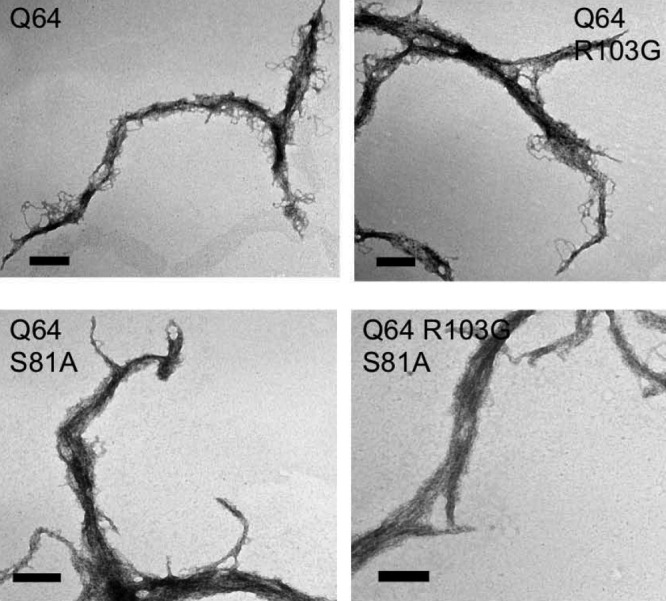
Figure 5.

Morphology of endpoint aggregates in unchanged. Transmission electron microscopy of (A) ataxin-3(Q64), (B) ataxin-3(Q64) R103G, (C) ataxin-3(Q64) S81A, and (D) ataxin-3(Q64) R103G S81A. After 90 h of aggregation, samples were negatively stained using 1% uranyl acetate. Scale bar represents 200 nm.
