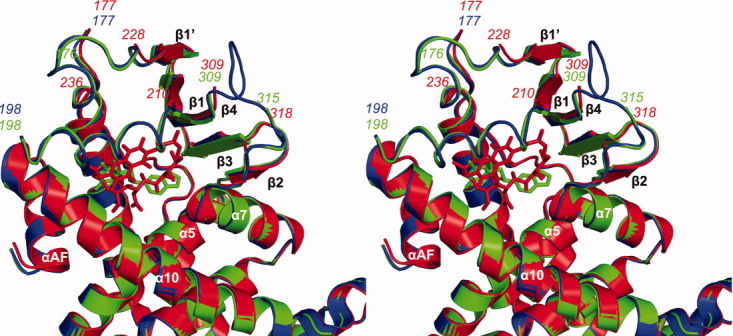
Figure 3.

Analysis of the ligand binding pocket of PXR-LBD-PNU complex. Stereoview of a superimposition between the apo-PXR (blue), PXR-PNU142721 (green) and PXR-rifampicin (red) complexes. Major secondary structures around the ligand-binding pocket are labeled. The hydrogen bond is represented by a red dash line. [Color figure can be viewed in the online issue, which is available at wileyonlinelibrary.com.]
