
Figure 2.
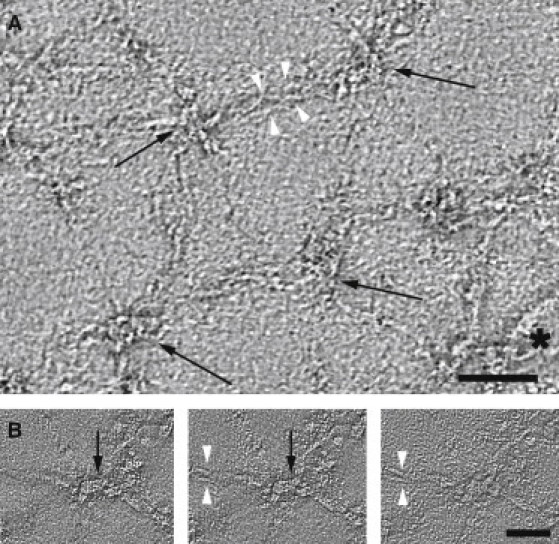
Negative-stain electron tomography of the expanded membrane skeleton. (A) Tomographic slice (5.9 Å thick) from a negatively stained, expanded membrane skeleton reveals junctional complexes (black arrows) and spectrin heterotetramers. Separation of the α- and β-spectrin molecules is sometimes visible distal to the junctional complexes (white arrowheads). Residual membrane fragments are occasionally present in the preparation (asterisk). Scale bar, 60 nm. (B) A series of high-magnification tomographic slices (3.6 Å thick) through a node in the spectrin network (black arrow) reveal a short (∼30 nm), filamentous structure that corresponds to the junctional complex. This filamentous structure appears slightly bent, perhaps reflecting flexibility or distortion of F-actin at the junctional complex. Spectrin heterodimers are seen emanating from this complex and can be seen to bifurcate into individual α- and β-spectrin molecules ∼50 nm away from the node (white arrowheads). The three individual xy slices shown are separated by 7 Å in the z direction. Scale bar, 45 nm.