Figure 3.
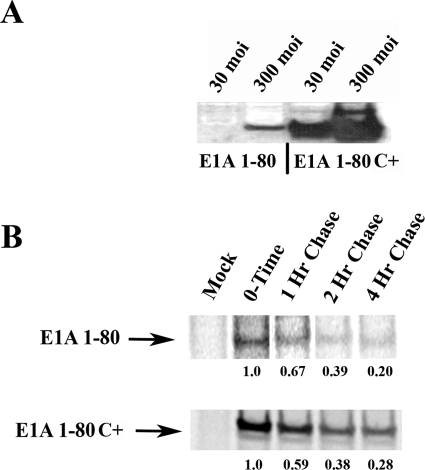
E1A 1-80 modified at its C-terminus (E1A 1-80C+) is expressed from an Ad vector at high levels. (A) A549 cells were infected at 30 or 300 moi and subjected to Western blot analysis as described in the Materials and Methods section. E1A 1-80 C+ is expressed at much higher levels than E1A 1-80. (B) Pulse-chase analysis demonstrates that the turnover rate for E1A 1-80 and E1A 1-80 C+ proteins are approximately the same. The relative amounts of expression are indicated below each lane. Levels of expression were quantitated by phosphorimage analysis using a Typhoon Trio (GE Healthcare, Piscataway, NJ). Data are from a representative experiment.

