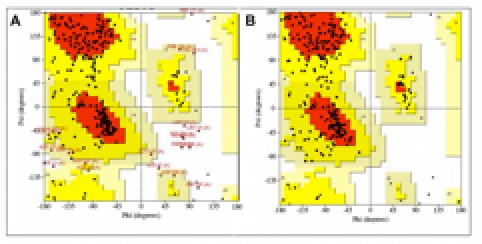
Figure 1.

Representative Ramachandran plot of φ-ψ dihedral angles of a modeled SB serine protease structure before and after backbone refinement. PROCHECK was used to check the distribution of φ-ψ dihedral angles and eliminate Ramachandran outliers in each modeled protease structure (A, before; B, after refinement). Residues whose φ-ψ pairs fell outside the most favourable (red) and additional allowed (yellow) zones are annotated in red. Representative Ramachandran plots from the P. falciparum modeling are shown.
