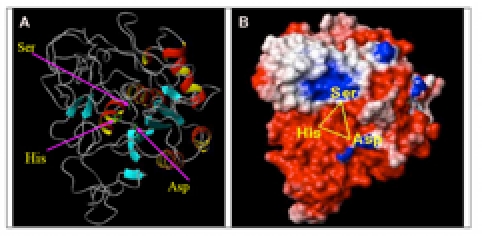
Figure 3.

Modeled SB protease structure from Pyrococcus furiosus (PMDB ID: PM0075943). A) Ribbon model showing beta-sheets are shown in (light blue) and with arrow directed to C-terminus, alpha-helices (red and yellow), turn/loops (gray), and catalytic triad residue side chains (green sticks). B) Surface electrostatic potential model showing negative (red), positive (blue), and neutral (white) charges.
