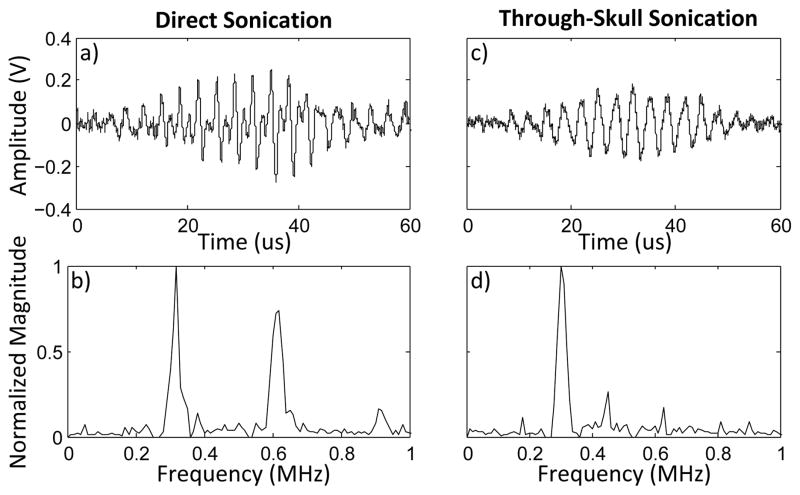
Fig. 11.
Waveform (a) and frequency spectrum (b) for direct sonication of a 25:1 solution of Definity contrast agent. Waveform (c) and frequency spectrum (d) for through-skull sonication of a 10:1 solution of Definity contrast agent. The timing shown in figures a) and c) are to show scale, and time t = 0 marks the start of the waveform capture.

