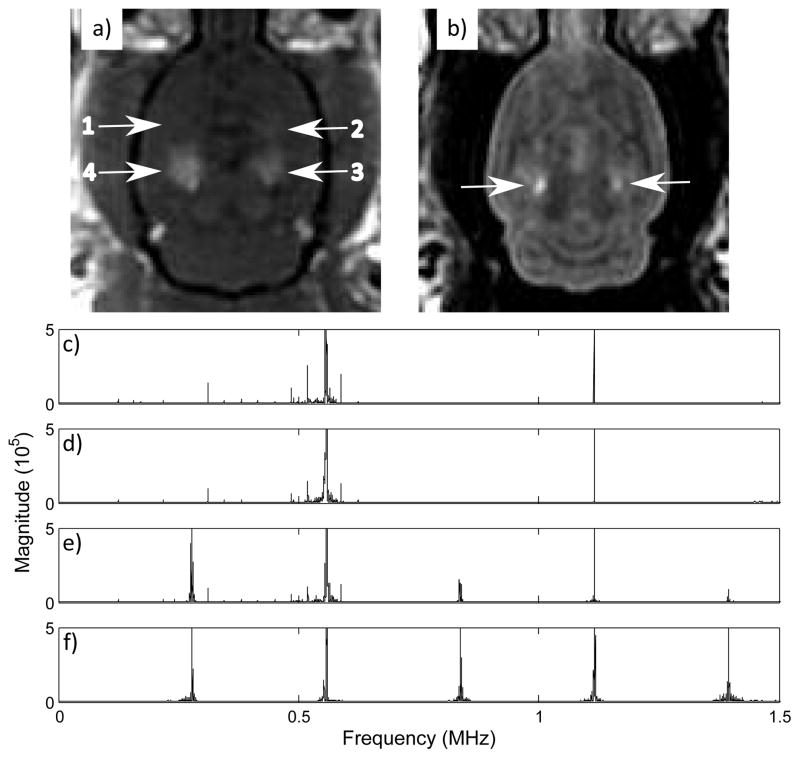
Fig. 13.
a) Contrast enhanced T1-weighted image showing enhancements at sonication locations 2, 3 and 4; b) Corresponding T2-weighted image showing edema at locations 3 and 4; frequency spectra from 0 to 1.7 MHz for c) location 1 (0.15 MPa), d) location 2 (0.18 MPa peak negative pressure), e) location 3 (0.22 MPa peak negative pressure), f) location 4 (0.27 MPa peak negative pressure).

