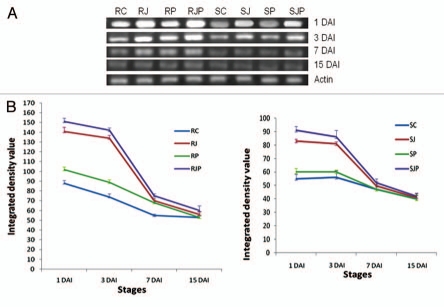
Figure 4.
(A) Semiquantitative RT-PCR of WC3 on 1 DAI, 3 DAI, 7DAI and 15 DAI for different treatments as indicated in the figure. (B) Variation in the expression of WC3 under different treatments and stages. Data plotted are an average of three independent experiments. Line at points represents standard deviation of the mean. (Left part and right part represent treatments on resistant and susceptible variety respectively).

