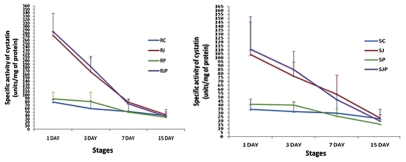
Figure 6.
Summary of variation in specific activity of cystatins (in Units/mg of protein) determined spectrophotometrically in developing wheat spikes subjected to various treatments on 1 DAI, 3 DAI, 7 DAI and 15 DAI in the resistant (R) and susceptible (S) variety. RC and SC: control, RJ and SJ: JA treated, RP and SP: Pathogen inoculated, RJP and SJP: JA treatment followed by pathogen inoculation. (Left part and right part represent treatments on resistant and susceptible variety respectively).

