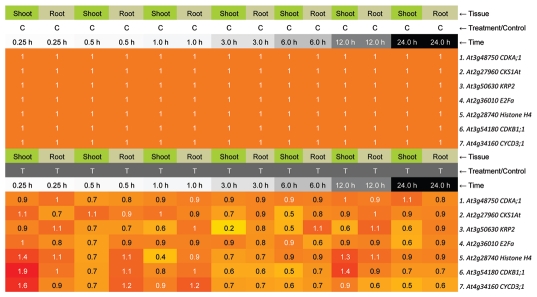
Figure 2.
In silico expression of cell cycle related genes from published micorarray data.7 Time indicated represents 15-min UV-B treatment and the time left in standard chamber without UV-B. The figure was generated by Bio-Array Resource for Plant Biology website (bbc.botany.utoronto.ca/).

